


$2.4 Billion
Losses to eutrophication damages for Lake Erie 2011-2017

200,000+
Fish killed in one low-oxygen event, Maryland, 2025
(Source: Maryland Dept. of the Environment)

2
Cleanings a season with AquaRealTime, down from weekly
(Source: City of Akron case study)
Monitoring for every type of water

Drinking water:
Source water reservoirs and intakes

Wastewater:
Lagoons, effluent, and receiving waters

Agencies, watersheds:
Monitoring networks across a watershed

Irrigation:
Canals, ditches, and delivery channels

Cities and Recreation:
City lakes, parks, beaches, and stormwater ponds

Aquaculture:
Hatcheries, raceways, and ponds

How It Works

1. Measure
Sensors read the water: built into the AlgaeTracker at the surface, or on a TrackerSonde or single sensor from the surface down to 200 m.

2. Connect
An AlgaeTracker or Sentinel on the water, or a TrackerNode on shore or indoors, powers the sensors and sends data over managed cellular.
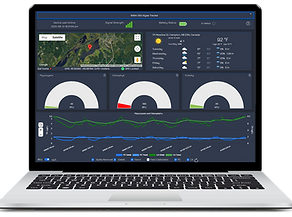
3. See and Act
Live readings, alerts and trends on the AquaRealTime dashboard from any browser, or sent straight to your SCADA system through our API.
What Our Clients Say
Working with AquaRealTime is… it’s easy… It takes one person. They’re very small and lightweight… They’re online instantly… and then they don’t require a lot of maintenance either.”
Jessica Glowczewski, Watershed Superintendent, City of Akron, Ohio
“
Having access to real-time lab-quality data at my fingertips on my phone or my computer is something that I really can't live without."
Tony Guida, Lead Project Manager, Nano Infusion Technologies, Colorado
“
“
We've been able to monitor pond conditions, place pre-emptive phone calls to clients, and treat before algae becomes a major issue. Turbidity measurements also allow us to predict and monitor effects of runoff and make more timely management decisions."
Jeff Stelzer, Sr. Biologist, Lake and Pond Solutions Co, Wisconsin
“
These units have been an absolute smash success… having a device that collects water quality data, in real time, with such ease of use, has been an incredible asset for our monitoring programs!"
Sarah Blenis, Hammond River Angling Association, New Brunswick


One system, from sensor to dashboard


Your water quality data on one dashboard
See every site, live
-
Readings every 30 minutes, uploaded every 2 hours, with maps and gauges
-
Email alerts when levels cross your thresholds
-
Emailed status reports
-
GPS location and drift alerts for every buoy
Analyze, compare, and share
-
Cross-device graphical comparison
-
Historical charts for trends and treatment results
-
Nearby weather station history alongside your data
-
Early trend data to inform your own predictive insights
-
Export any chart, plus CSV data
-
Integration: REST API for SCADA, websites, and other systems

Why AquaRealTime
-
Easy to start, easy to expand: Start with an easy-to-use buoy, then add sondes, sensors, and shore stations as your needs grow.
-
Up and running fast: One person installs a system in under an hour, with data on your dashboard within 5 minutes. No software or cellular setup.
-
Self-cleaning: A brush wipes the sensors before every reading, so you visit sites less often.
-
Connectivity: Cellular data 100% managed by AquaRealTime; satellite coming soon.
-
Reliable data: Factory-calibrated sensors that store their own calibration, with accuracy specs published for every sensor.
-
Support in the US and Canada: Teams in Boulder, CO, and Ottawa, ON
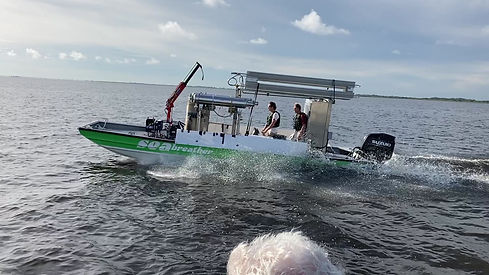
Deploying AlgaeTrackers on Lake Okeechobee, FL

